others-how to monitor nginx with prometheus and grafana ?
1. Purpose
In this post, I would demo how to monitor nginx with prometheus and grafana.
2. Environment
- Linux
3. The solution
3.1 Make sure that ‘http_stub_status_module’ is enabled in your nginx
We need http_stub_status_module module to expose metrics of nginx to prometheus, verify as follows:
$ nginx -V
If you find the -http_stub_status_module in the response, then you are done.
Otherwise, you should enable your nginx , you can refer to this article for this job.
3.2 Expose the nginx status page
Now we should add a server in nginx to expose the status page of it:
    server {
        listen 8080;
            server_name localhost;
            location /nginx_status {
           stub_status;
               allow 127.0.0.1;    #only allow requests from localhost
               deny all;        #deny all other hosts
        }
    }
Here we listen to 8080, and you can visit /nginx_status to get the status of nginx:
$ curl http://localhost:8080/nginx_status
Active connections: 30
server accepts handled requests
 156781 156781 158849
Reading: 0 Writing: 29 Waiting: 1
3.3 Download nginx prometheus exporter
Now we should convert the nginx metrics to a format that prometheus can read, let’s do it with the nginx_prometheus_exporter:
$ wget https://github.com/nginxinc/nginx-prometheus-exporter/releases/download/v0.9.0/nginx-prometheus-exporter_0.9.0_linux_amd64.tar.gz
Extract it and start it as follows:
$ ./nginx-prometheus-exporter -nginx.scrape-uri=http://localhost:8080/nginx_status

2021/04/07 11:02:31 Starting NGINX Prometheus Exporter version=0.9.0 commit=5f88afbd906baae02edfbab4f5715e06d88538a0 date=2021-03-22T20:16:09Z
2021/04/07 11:02:31 Listening on :9113
2021/04/07 11:02:31 NGINX Prometheus Exporter has successfully started
If you want to start it in the background, you can run it with nohup:
$ nohup ./nginx-prometheus-exporter -nginx.scrape-uri=http://localhost:8080/nginx_status > nohup.out &
3.4 Configure prometheus job
Now we have the metrics page, and we want prometheus to scrape it regularly. Add these lines to prometheus.yml:
  - job_name: 'nginx'
    static_configs:
     - targets: ['localhost:9113']
Now restart prometheus.
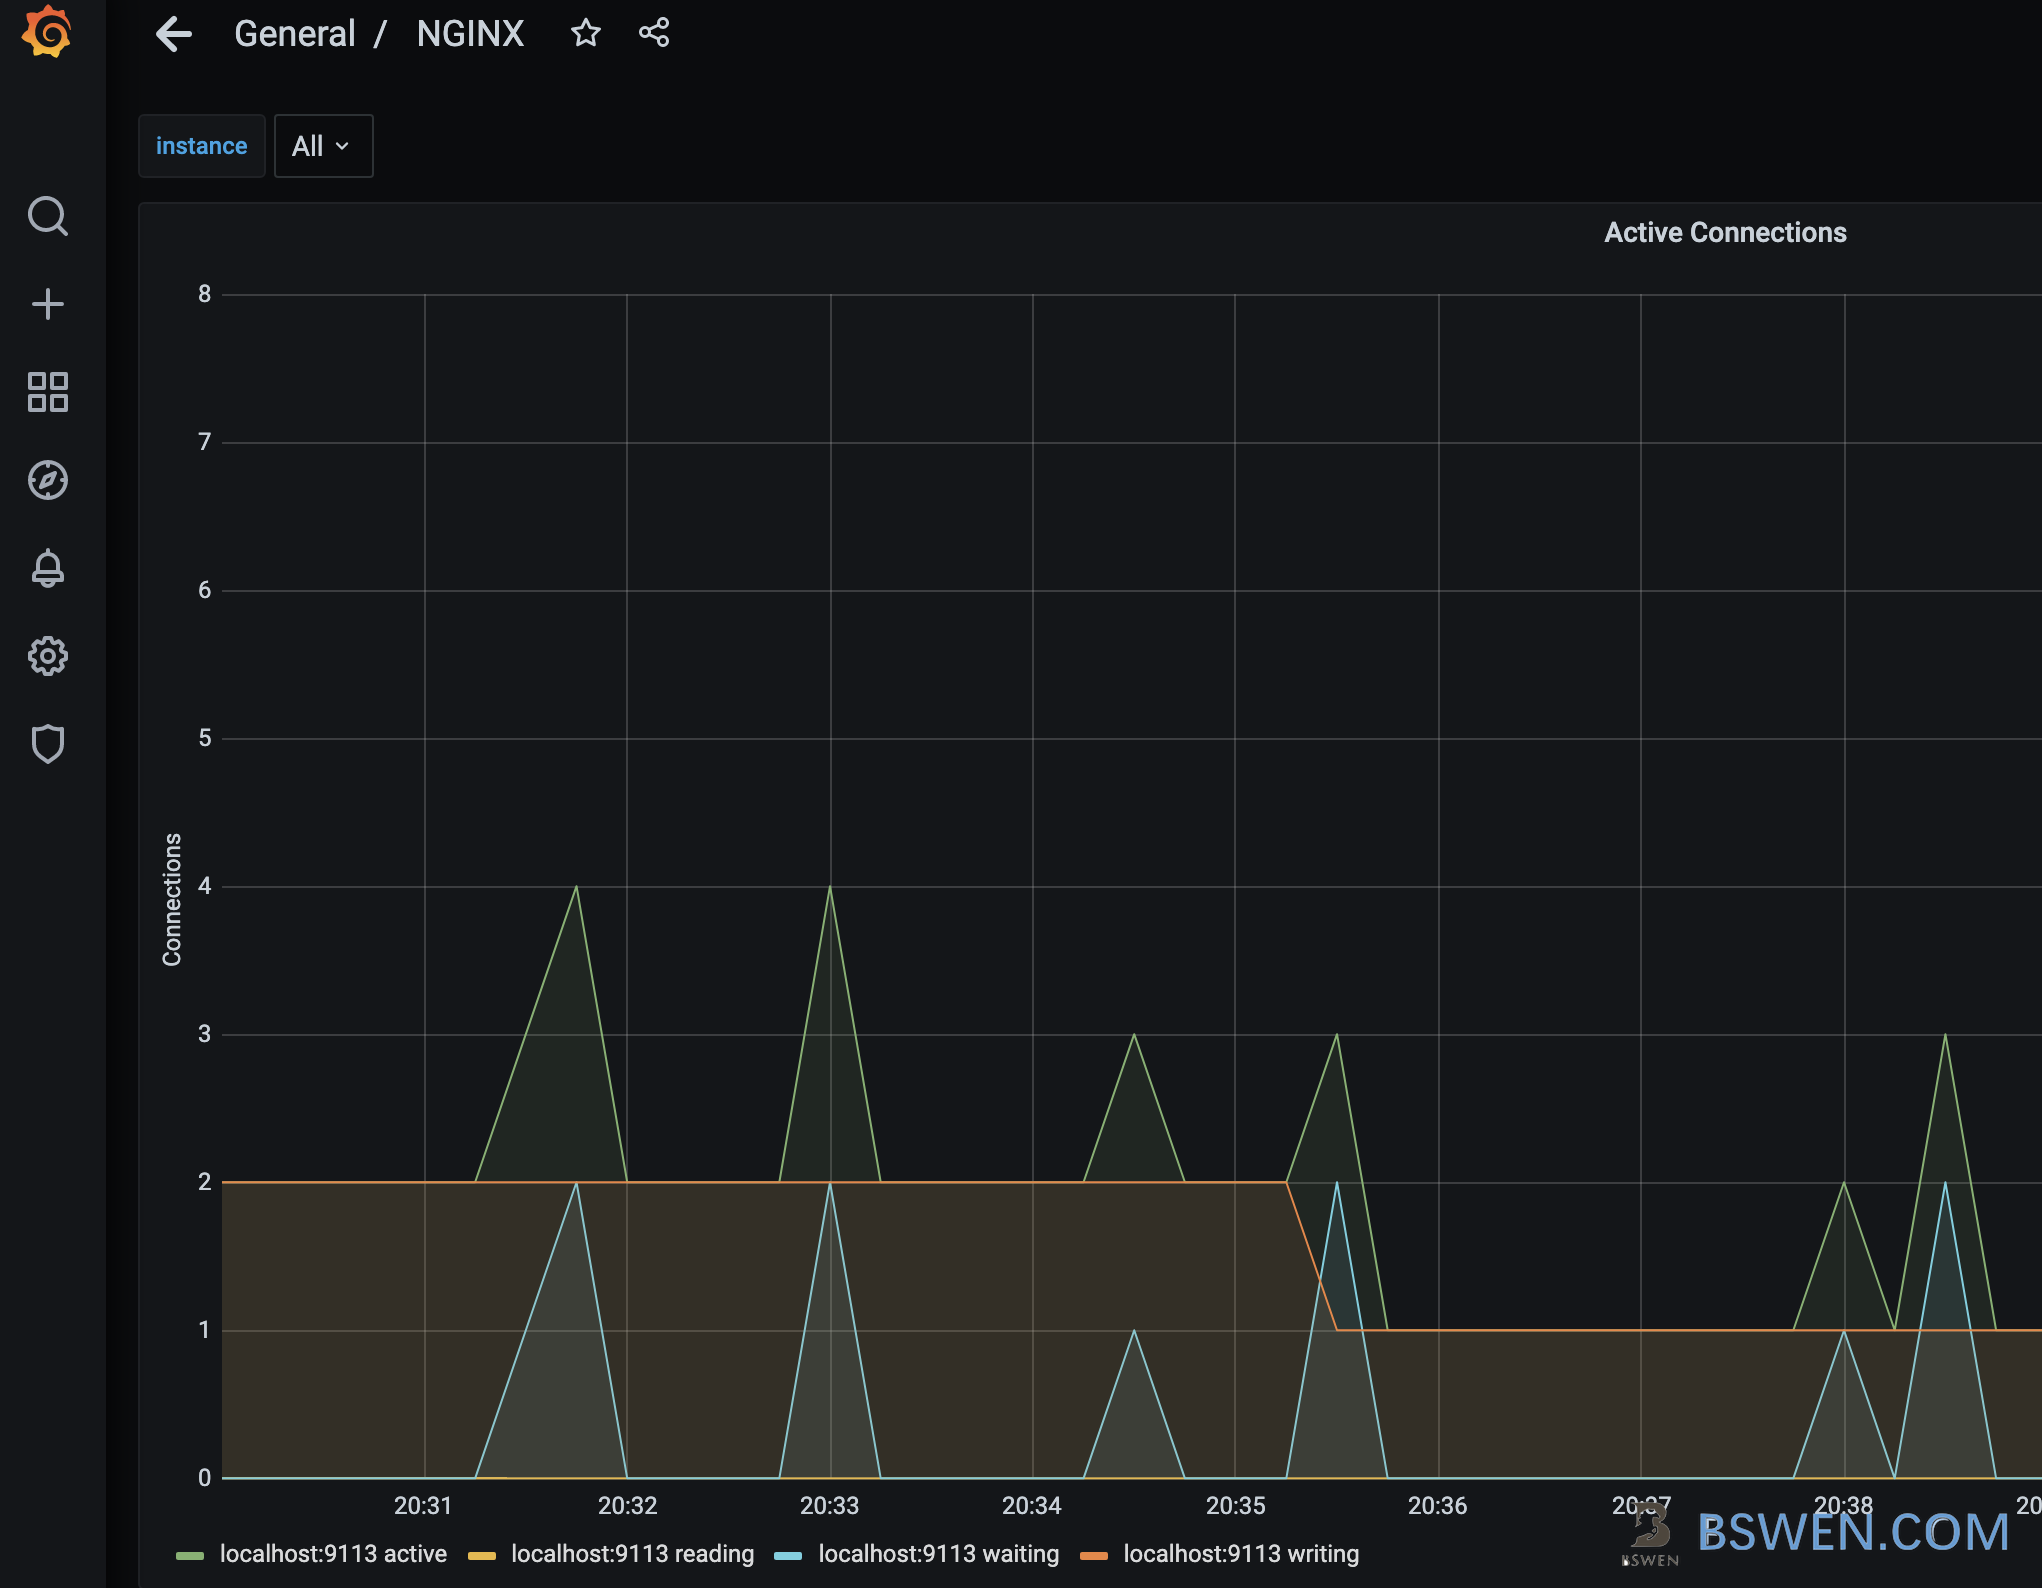
3.5 Configure grafana dashboard
We can import a nginx official dashboard (https://grafana.com/grafana/dashboards/11199) , and then we can see the result:
It works!
4. Summary
In this post, I demonstrated how to monitor nginx with prometheus and grafana.